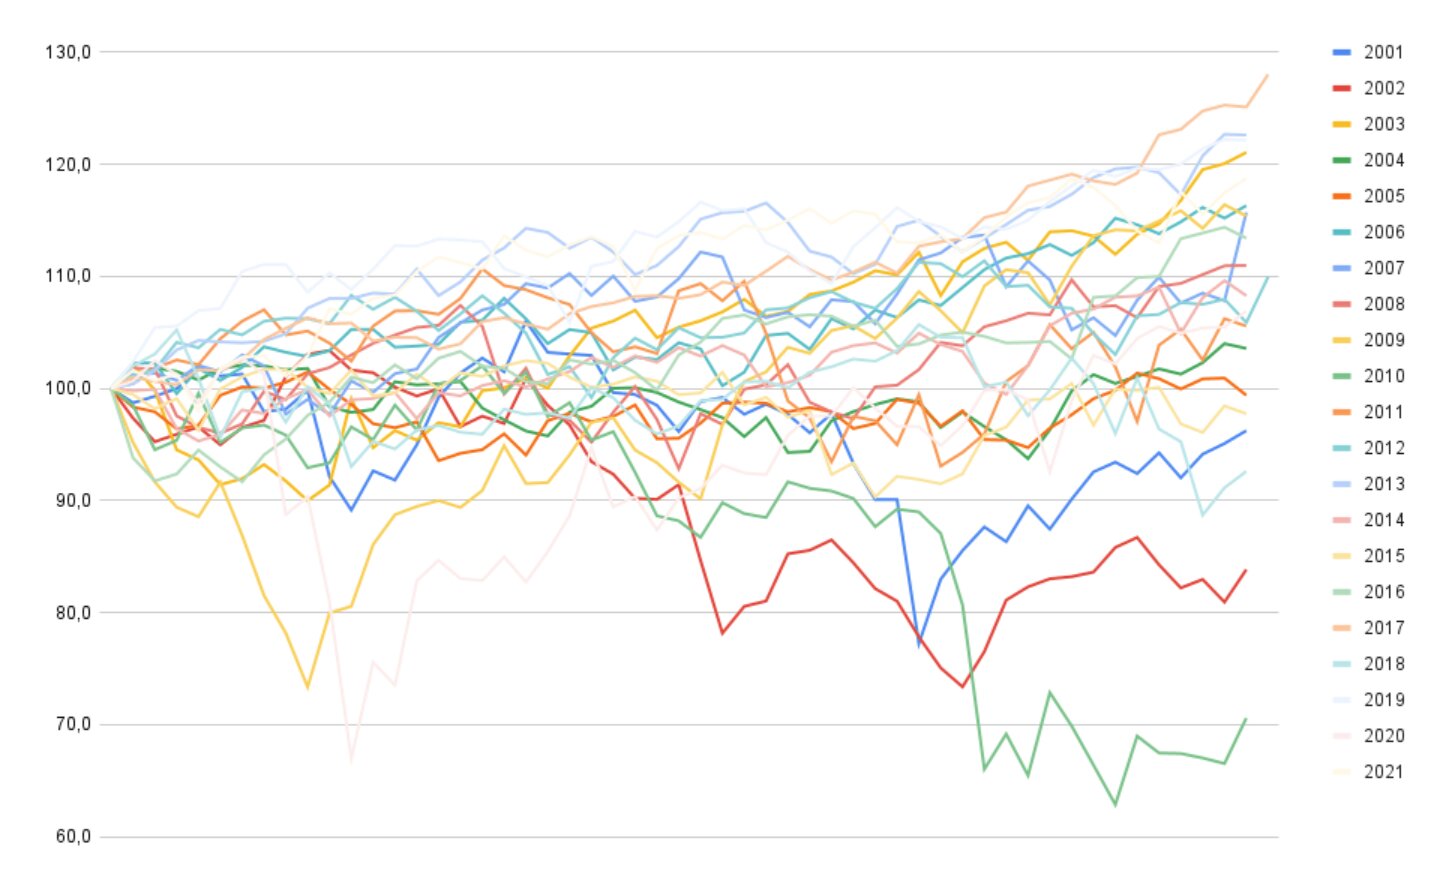
Looking back at these 20 years of US equity.. Thoughts on any trends? (Not telling you mine right away to avoid influencing you).
I just made this chart (data from investing.com of weekly $DJ30 ).
info@peterlavi.com
About
Physician (MD) ・Stocks and ETFs investor ・10+ years of investing
・Keen on reading, reading and reading ・Writing on Forbes, SeekingAlpha, GuruFocus, and Yahoo Finance
This material is provided for informational purposes only and does not constitute investment advice. Trading financial instruments involves significant risks, including potential loss of capital.
Past performance is not a reliable indicator of future results.
Market prices fluctuate, dividends and returns are uncertain, and exchange rate movements may affect investments denominated in foreign currencies. Each individual must assess their risk tolerance accordingly. No universal investment formula exists, and no financial instrument is risk-free. The data used in this material is obtained from sources believed reliable, though accuracy cannot be guaranteed. Being an investor means assuming risk with the aim of achieving returns.
Your capital is at risk | Copy Trading does not amount to investment advice | Your investments value may go up or down
www.peterlavi.com ©


