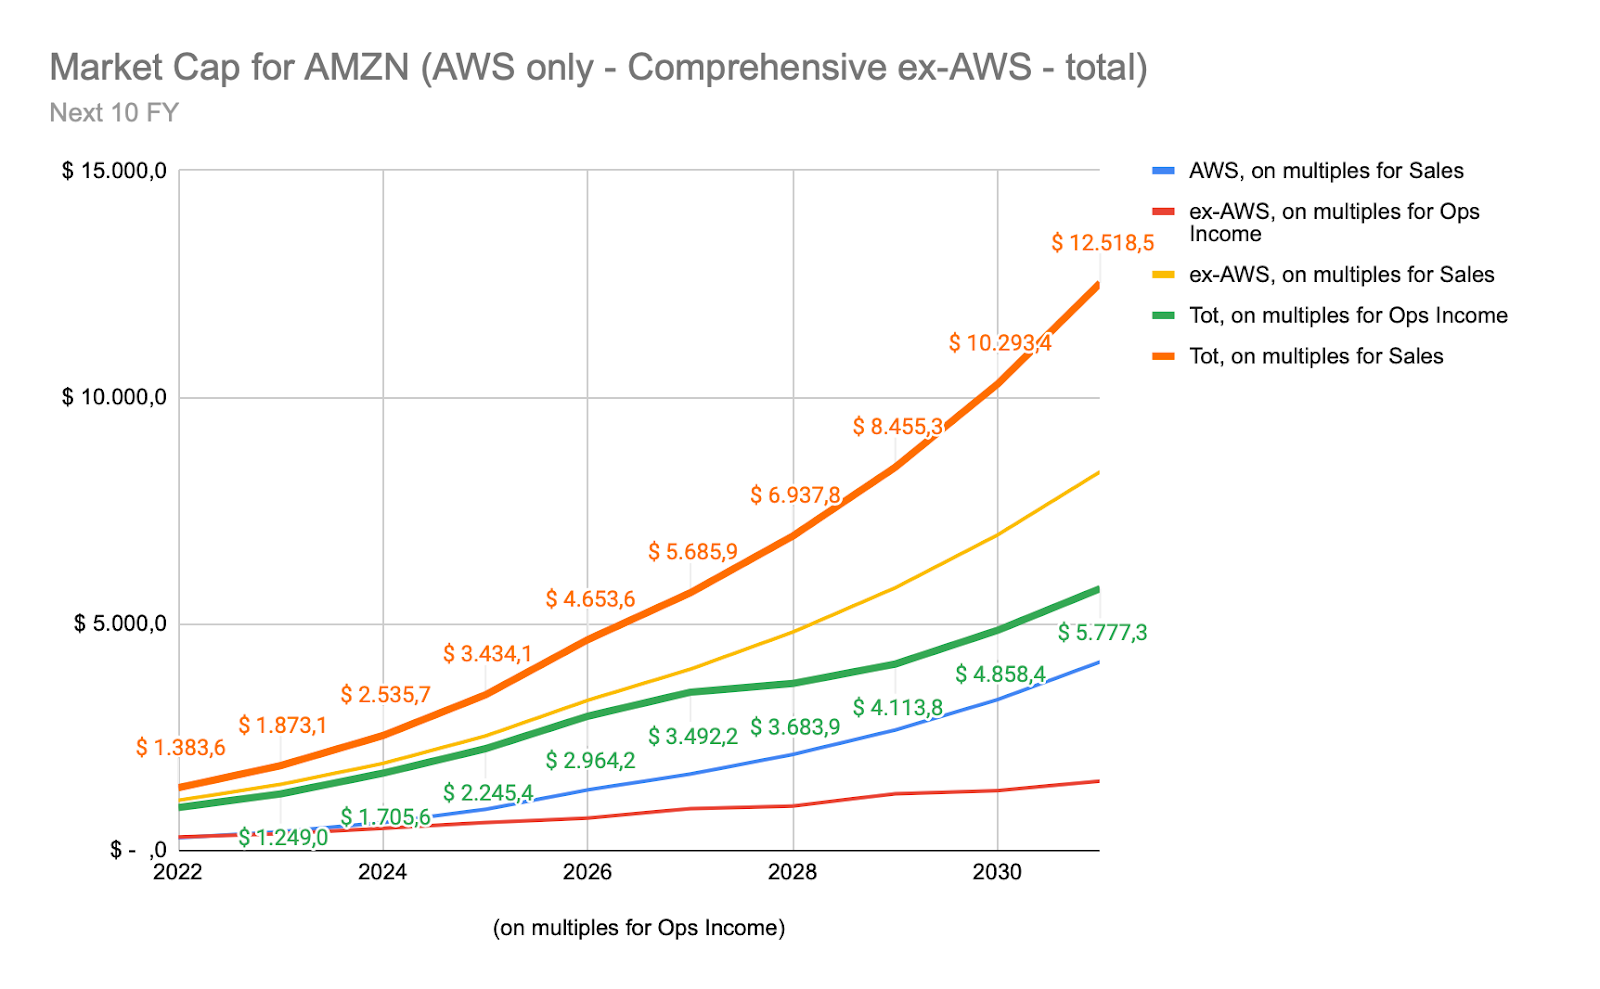
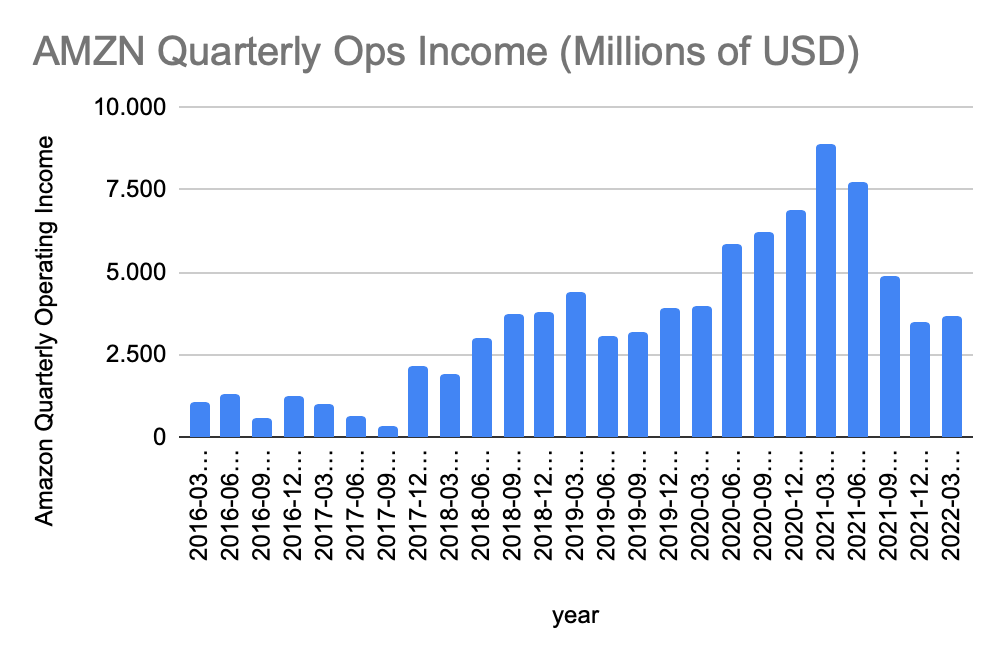
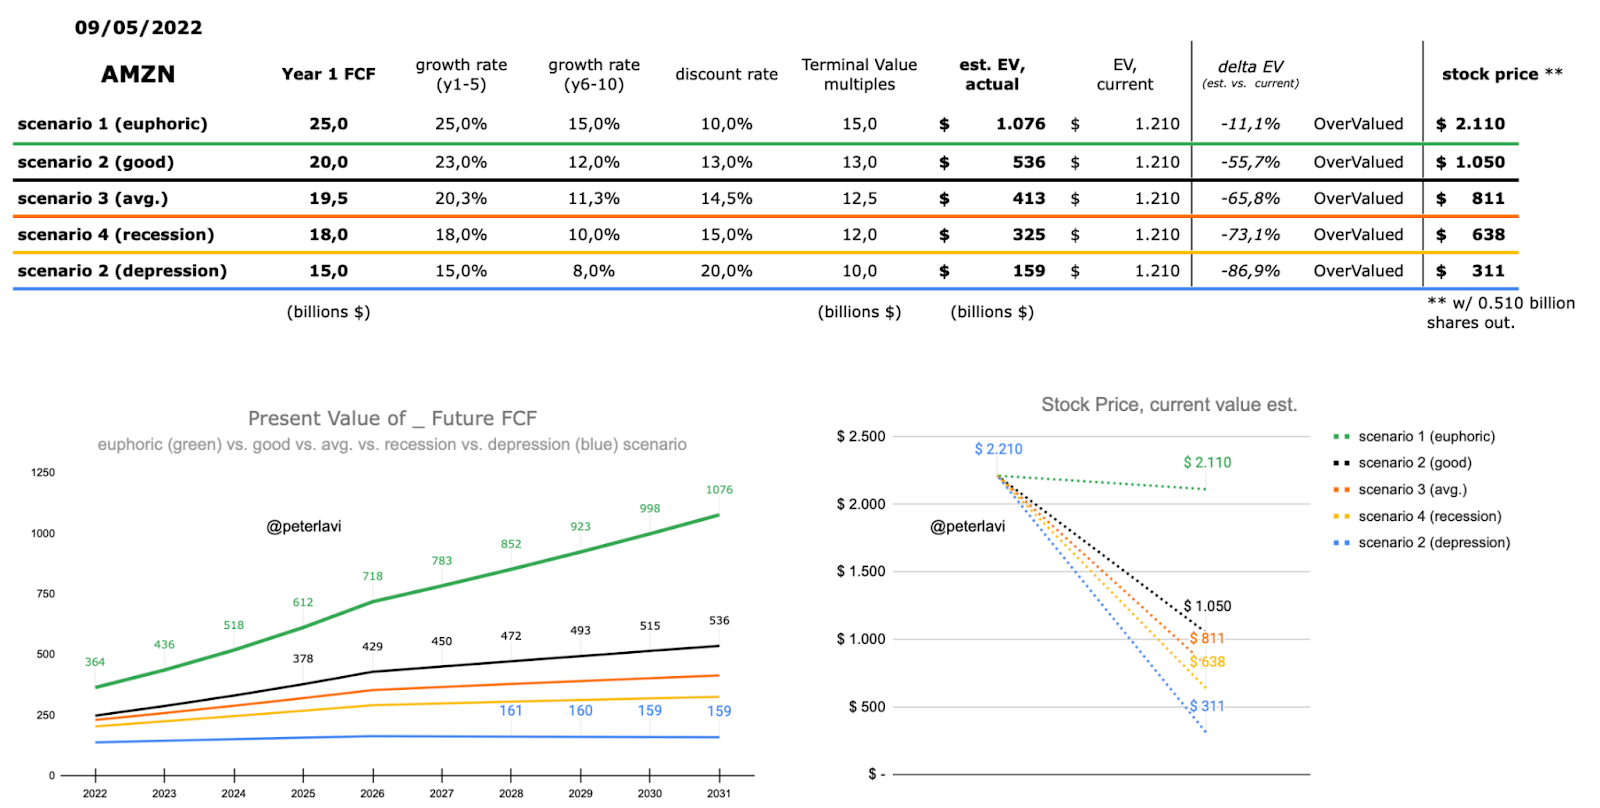
Summary Bulletpoints: To answer the question I asked in the title I’d like to look from a different perspective: Enterprise Value. Enterprise Value (EV) gives the aggregate value of a firm as an enterprise as we long-term investors like to do. It is calculated as follows: So it really is a useful metric to assess the health of a company. As of the time of writing Amazon.com, Inc. has a market capitalization of $ 1120 billion and an EV of $ 1210 billion. The price is $ 2210 per stock. I used a discounted cash flow method (DCF) but based on Enterprise Value (EV). All data used are publicly available (Yahoo Finance, Amazon Investors Relations). Given the complexity of the Company (and the fact I like to cover as many blind spots as possible), I simulated FIVE scenarios: Values used as growth rates are presented in the image attached. Remember that the higher the “discount rate”, the more conservative the estimate. The DCF I used is a simplified version which avoids all the hocus pocus of guessing the right risk-free rate and it first estimates the EV and then the stock price. The rationale behind the input numbers for the growth rate is double-fold: 1/ growth rate in the past years (FY2017-2018-2019 + Q1-2020, see below for a short explanation) averaged: _ 9.6% for FCF _ 53.3% for Operating Income 2/ analysts' consensus of: _ growth rate is 40.5% for next 5 years (but -75.9% for the current year) _ sales growth rate is 11.9% for current year and 16.9% for next year Plus from a personal simulation (summary charts attached below), growth rate for total Net Sales in the next 5 years yielded 28.3% and 16.9% for the next 5 years. Hence I decided to input a 25% growth rate for the euphoric scenario all the way down to 15% for the depression scenario (even if this growth rate was almost double the one reported by the Company in the past for FCF). Here are the summary charts for the personal simulation of Net Sales, for the next 4 and 10 Fiscal Years plus the growth rates and multiples I imputed in. Source: Author’s work. Next 4 Fiscal Years. Source: Author’s work. Next 10 Fiscal Years. Source: Author’s work. Growth rate and P/S and P/OI multiples used. To clarify why in point 1/ I decided to account only for FY 2017-2018-2019 and Q1-2020, I’d like to show you some graphs made from the Operating Income numbers. Source: Author’s work. Source: Author’s work. Logarithmic scale. In the first chart yearly numbers are presented and you can notice a clear trend upwards with minor setbacks (FY2014 and FY 2017) and overall it seems pretty stable (yet slowing) also on a logarithmic scale (second chart). Source: Author’s work. Source: Author’s work. In light gray Q2-2020 to Q2-2021 numbers. Source: Author’s work. Q2-2020 to Q2-2021 numbers omitted. Now, if you widen the gaze to the quarterly numbers show a pretty different picture (perhaps more accurate). During the "first and major COVID hit" (Q2-2020 to Q2-2021) there was a pretty strange consistent upward trend and it occurs not in the "classic" holiday season (Q4 to Q1). The explanation is self evident but perhaps a one time only occasion. When you clear these (great) quarterly results out of the picture you can appreciate the presence of a stagnant trend since Q2-2018 ! In hindsight it recalls the stagnant trend seen in the stock price movement (see graph below). Source: Apple’s App “Borsa”. Assuming to hold the company for the following 10 years, we discounted the value it will have the 10th year all the way back to these days (Current Value of Future FCF). The resulting Enterprise Value is quite interesting: “only” a $ 1076 billions (or -11.1% from current) even in the best case scenario all the way down to $ 159 billions. Source: Author’s work. My previous bull case for the Company was relying of FY2021 to reveal a FCF of at least $25.9 billion but.. here we are again, FY2021 numbers were not so brilliant (were negative in fact). Reasons for that? Management team (and I agree) attributed one third of the fault to inflation (higher energy prices and labor costs) and the rest to internal factors determining higher Capital Expenditures (CapEx) to deal with COVID-related higher demand and hence a one-time expense. I think there’s also to highlight the increasing competitiveness in the retail space (with Walmart, Costco and Alibaba) but in particular in the cloud sector (with deep pockets juggernauts like Google, Microsoft and Apple). In short: more competition means more CapEx and hence a lower FCF number and perhaps lower margins. In conclusion none of the 5 scenarios described appear to indicate an undervalued company, au contraire it seems pretty overvalued for the current FY. NO, Amazon is not over and the Company will stick around for quite a long time, but the current valuation must be deflated in order to consider buying again. I’ll rate it as Neutral and I will neither add nor sell any exposure at this price. : I/we are long AMZN, GOOG, MSFT, AAPL. AMZN On Sale or In Trouble?
Calculating fair value
Back to the valuation..
FY2021 Results Changed the Picture
Conclusion
Disclosure
info@peterlavi.com

About
Physician (MD) ・Stocks and ETFs investor ・10+ years of investing
・Keen on reading, reading and reading ・Writing on Forbes, SeekingAlpha, GuruFocus, and Yahoo Finance
AMZN On Sale or In Trouble?
AMZN On Sale or In Trouble?
2022-05-09 22:38
2022-05-09 22:38
Pietro Lavisci, MD
Pietro Lavisci, MD

Considering five scenarios for AMZN valuation as FY 2021 financial results change the picture. In hindsight there were perhaps some evidence already..


Azimut: High-Margin Italian Asset Manager With Growing Private Markets – But At What Price?
Pietro Lavisci, MD

Lettera fine 2025 - Annual Letter
Pietro Lavisci, MD

Volatilità in Saldo: Leva Asimmetrica e Copertura del Rischio di Coda
Pietro Lavisci, MD
This material is provided for informational purposes only and does not constitute investment advice. Trading financial instruments involves significant risks, including potential loss of capital.
Past performance is not a reliable indicator of future results.
Market prices fluctuate, dividends and returns are uncertain, and exchange rate movements may affect investments denominated in foreign currencies. Each individual must assess their risk tolerance accordingly. No universal investment formula exists, and no financial instrument is risk-free. The data used in this material is obtained from sources believed reliable, though accuracy cannot be guaranteed. Being an investor means assuming risk with the aim of achieving returns.
Your capital is at risk | Copy Trading does not amount to investment advice | Your investments value may go up or down
www.peterlavi.com ©