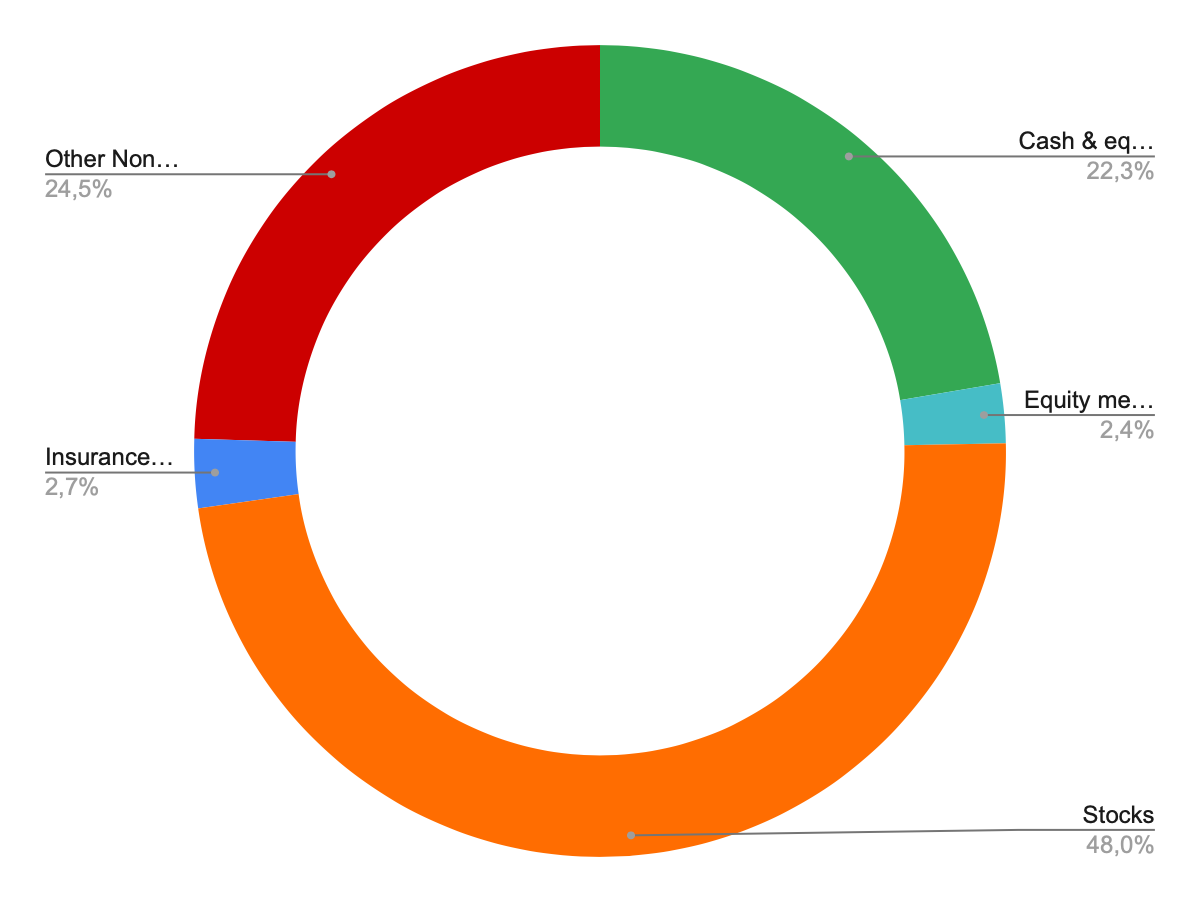
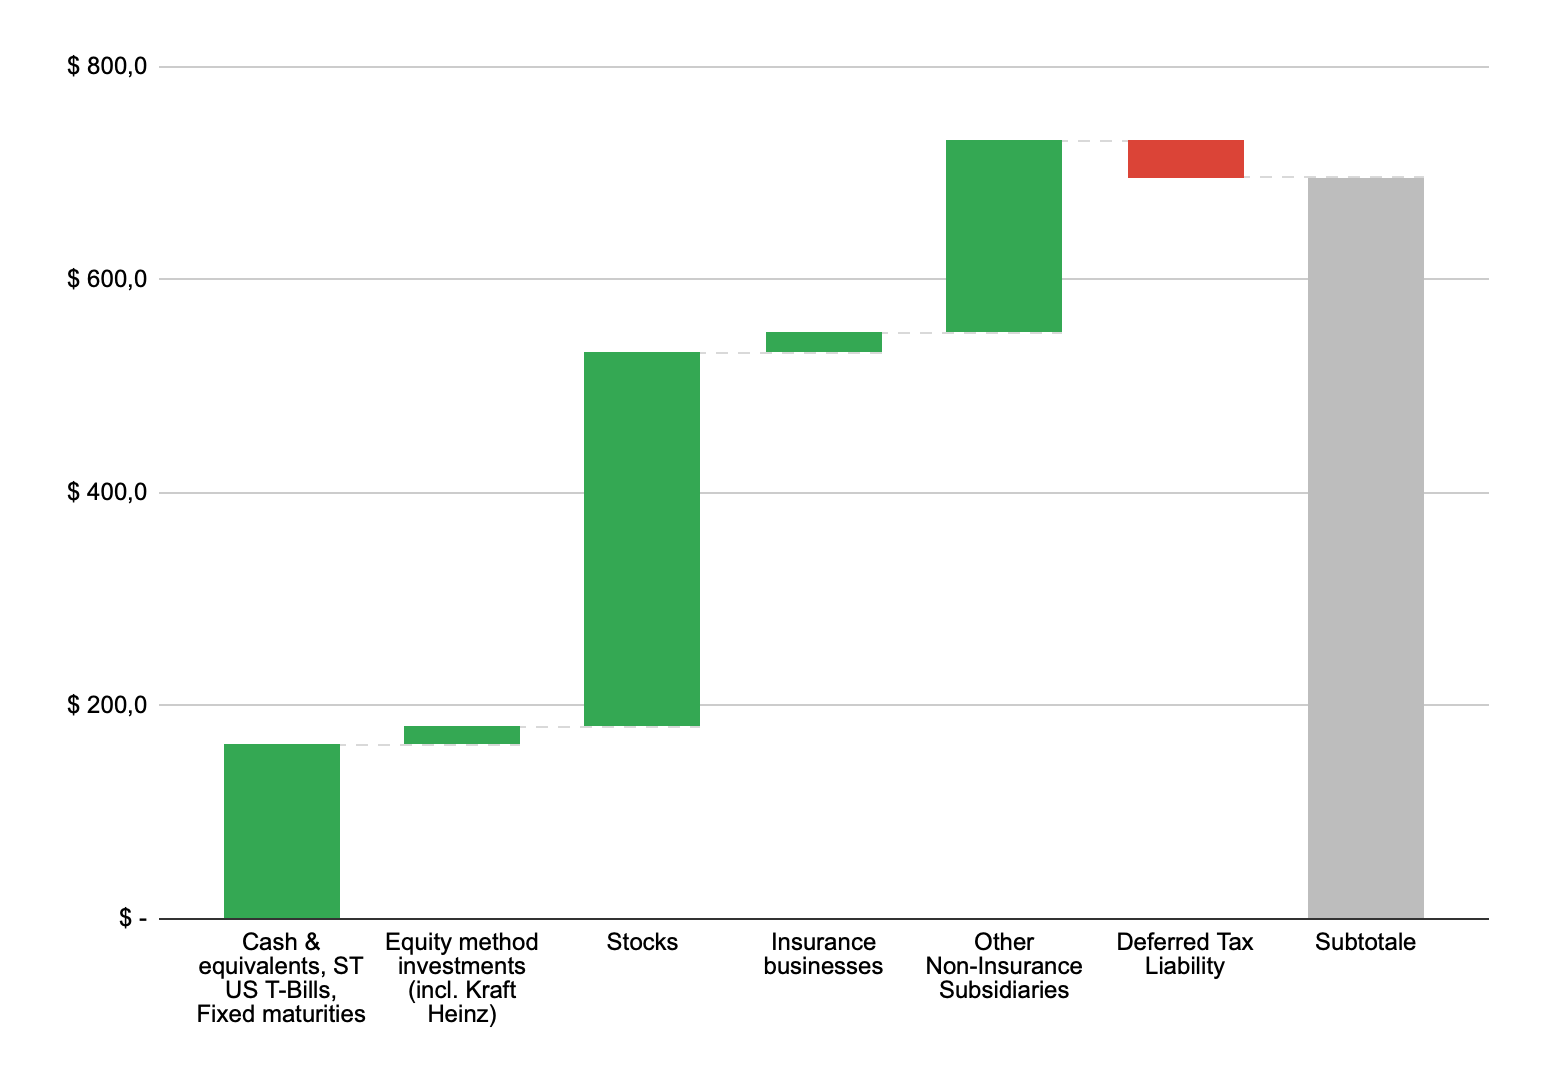
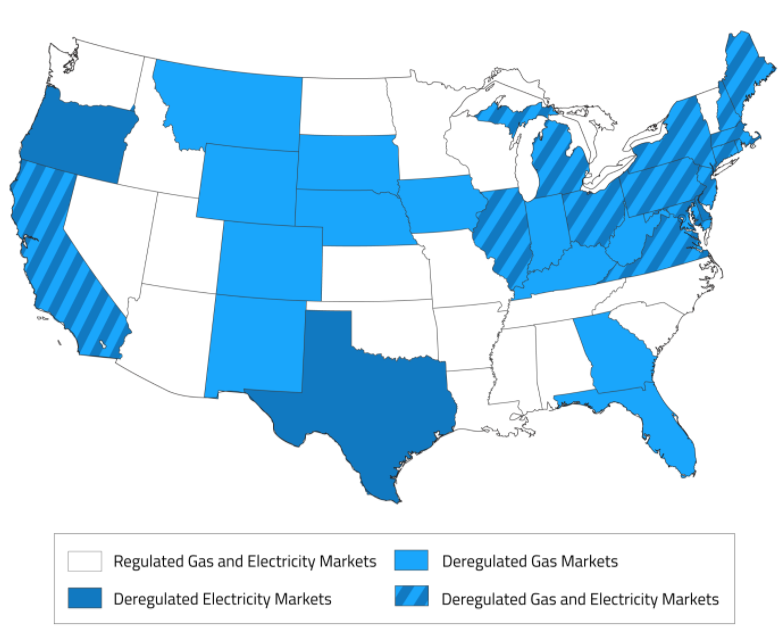
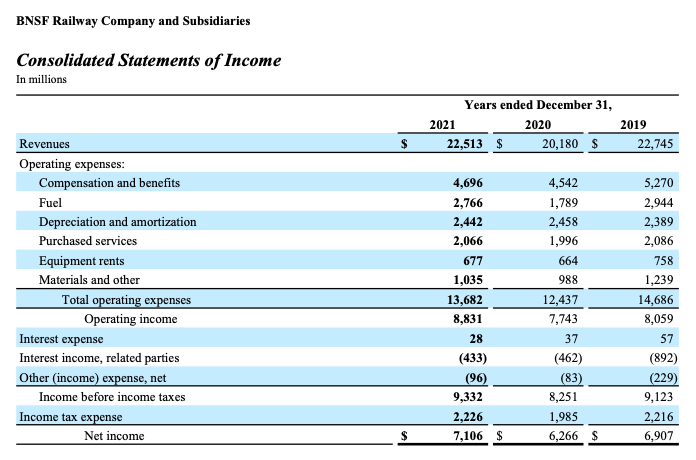
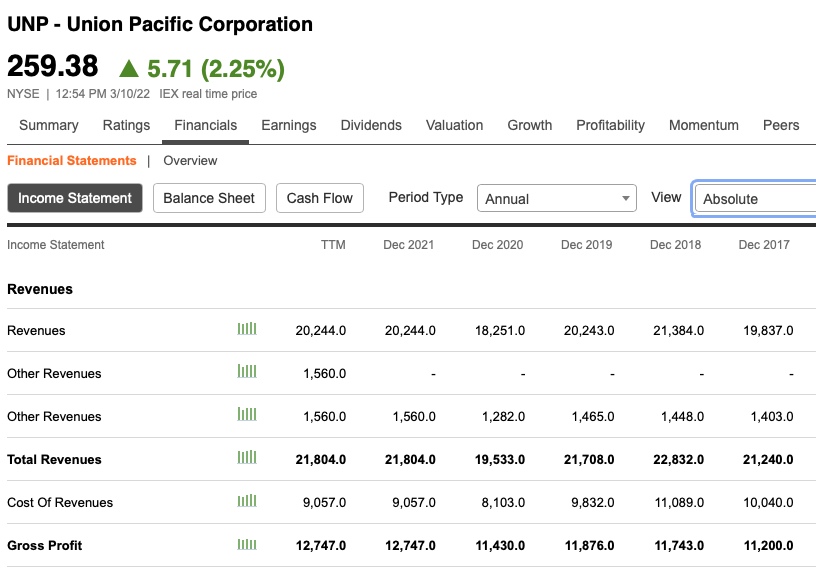
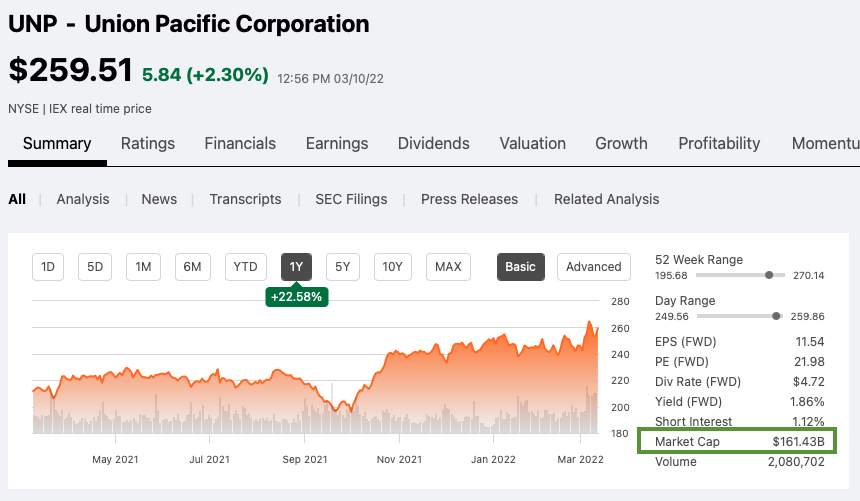
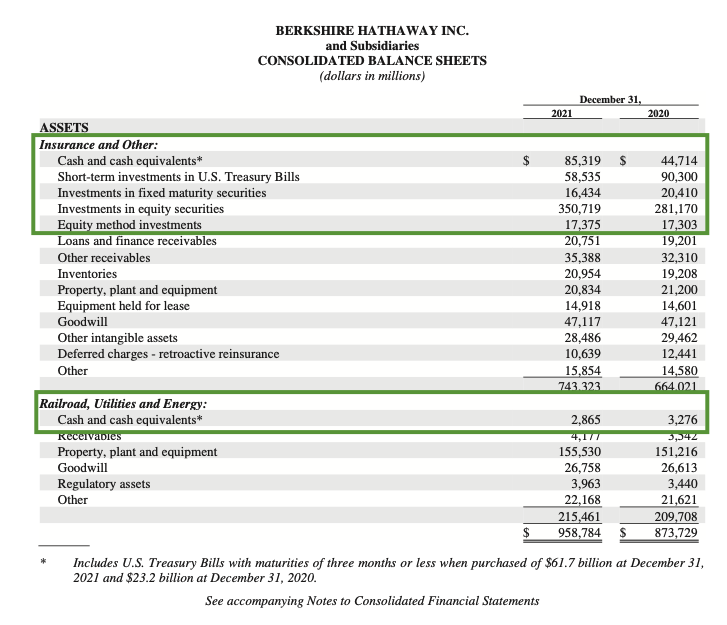
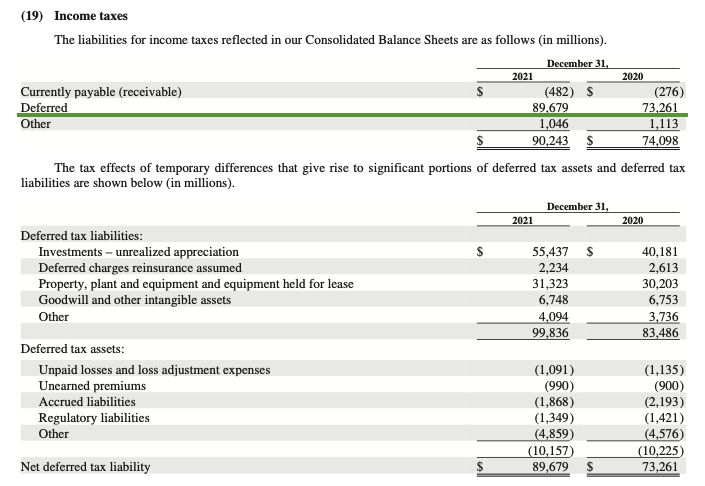
Berkshire Hathaway Inc. is a big holding company (meaning it owns “subsidiaries”). The style of management is unusual: it is decentralized (not blockchain yet though..). The centralized or integrated business functions are very few and are mainly related to macro policy setting and subsidy CEO selection. The Company and its consolidated subsidiaries employed around 372,000 people worldwide (77% in the USA). In order to better assess this multiplicity, we unpacked it into 5 different business segments (and not just the two macro-components of insurance and non-insurance) and 2 other relevant accounting items (non controlling interests and deferred tax liabilities). Here the reported market cap value of the different parts: 1) BHE (Berkshire Hathaway Energy) = $51 billion 2) Non-Controlling Interests = - $11 billion 3) BNSF (Burlington North Santa Fe) = $140 billion 4) Investments (as of last 10-K) = 4.1) Cash and cash equivalents, Short-Term investments in U.S. T-Bills, Fixed Maturities = $163 billion 4.2) Equity method investments = $17,3 billion (incl. Kraft Heinz) 4.3) Stocks = $350,7 billion (45% in AAPL stocks) 5) Insurance businesses (developed on both a primary and a reinsurance basis) = $20 billion 6) Other Non-Insurance Subsidiaries (Manufacturing, McLane, Services and retailing) = $179 billion 7) Deferred Tax Liability = - $35,1 billion To gauge for possible valuation mistakes I considered three scenarios: For the per share basis valuation, I considered a total of 2,21 billion shares (obtained from the conversion of the 615.330 class A to 0,92 billion of class B, and added to the 1,29 billion class B shares) as reported in the last annual report. The resulting per-class B share (detailed in the image attached) are: Source: Author's work. Here are some other graphics that may help visualize the value fragmentation (source: Author’s work). Source: Author’s work. Source: Author’s work. Let’s dig deeper in the different segments. BHE is in turn a holding company of (mostly) energy businesses. A little part (revenue-wise) is incidentally the biggest residential real estate brokerage in the USA. All of the businesses are locally managed. BHE is a consolidated subsidiary of Berkshire Hathaway (BRK.A - BRK.B) but not yet fully-owned. As of January 31, 2022 there were three major stockholders: (i) BRK (91.1%), (ii) family members and related or affiliated entities of the late Mr. Walter Scott, Jr. (a former member of BHE's Board of Directors) (7.9%), (iii) Mr. Gregory E. Abel (Chairman of BHE) (1.0%). Holding means that BHE operations are organized as 8 business segments: PacifiCorp, MidAmerican Funding (which primarily consists of MidAmerican Energy), NV Energy (which primarily consists of Nevada Power and Sierra Pacific), Northern Powergrid (which primarily consists of Northern Powergrid (Northeast) plc and Northern Powergrid (Yorkshire) plc), BHE Pipeline Group (which primarily consists of BHE GT&S, Northern Natural Gas and Kern River), BHE Transmission (which consists of BHE Canada (which primarily consists of AltaLink) and BHE U.S. Transmission), BHE Renewables and, last but not least: HomeServices (the largest residential real estate brokerage firm in the US and one of the largest franchise networks). It all accounts for: So, in summary BHE owns businesses that not only generate energy but also transmit, store, distribute and supply it. Its customers and end-users are dislocated across geographically diverse territories: 28 states located throughout the USA and in UK and Canada. An energy market is defined as “regulated” when the companies (utilities) have complete control (own and operate all electricity: from the generation to the meter, both the infrastructure and transmission lines and sell it directly to the customers). It is a de facto monopoly (limited consumer choice) but must abide by electricity rates set by state public utility commissions and guarantee stable prices and long-term certainty. First in the 70s (passage of the Public Utilities Regulatory Policies Act) and then in 1992 (the passing of the Energy Policy Act) the energy market began to be more open. The goals there were to increase the use of clean energy and energy efficiency. Hence, in a “nonregulated” electricity market competitors are allowed to enter and invest in power plants and transmission lines and also sell (to retail suppliers). Retail electricity suppliers set prices for consumers (often referred to as the “supply” portion in the bill). Source. The USA now has different types of electricity markets depending on the state and hybridization is also welcomed (partially to avoid the likes of the 2000 California energy crisis and the possibility of market manipulation) (see map attached). Source. Map of regulated and deregulated energy markets in the USA (source). BHE owns approximately 34,500 MWs of generation capacity in operation and under construction, of which: Rate-regulated businesses generated 86% of BHE’s consolidated operating income of FY202. The generation capacity the Company owns (both in operation and under construction projects) is made up of mostly renewables: Customers: the Utilities serve 5.2 million electric and natural gas customers in 11 states in the USA, AltaLink serves approximately 85% of Alberta, Canada's population, Northern Powergrid serves 3.9 million end-users in northern England. The BHE Pipeline Group operates approximately 21,100 miles of pipeline and transported approximately 15% of the total natural gas consumed in the USA during 2021. What’s more is the high quality of the BHE business both in terms of diversified portfolio (76% of adjusted net income coming from “investment-grade” (the highest in the credit reliability ladder) regulated subsidiaries and no single state providing more than 18% of energy operating revenue) and credit ratings (“credit ratings of A/A3 or better, as measured by Standard & Poor’s Investors Service and Moody’s, respectively”). All that to underscore the favorable terms under which they can get capital, when (and if) needed. Visualization of BHE diversified portfolio, source. An “easy” $0.5 billion EBIT with a gross margin of 8-9%. HomeServices, with services in all 50 states, closed over $189.4 billion of home sales in 2021 and is growing its brokerage, mortgage and franchise (currently 360 franchises worldwide) businesses. It generated $6.2 billion in revenues (or a third of the operating revenues from Energy) but with a “thin” gross margin of 8% or $0.5 billion for FY2021 (around the same $0.5 billion, or 9% margin for FY2020). (For a comparison Energy operations have a gross margin of 25% and is triple in size of revenue-generation, $18.9 billion for FY2021). Source: BHE’s 2021 10-K. All that said, let’s consider a conservative P/E of 10 for BHE, which is a little less than the average energy sector P/E. With FY2021 Earnings on common shares of $5.6 billion, we arrive at a market cap of $56 billion. We know that Berkshire Hataway ows 91.1% of BHE (meaning $51 billion) so it roughly has a $5 billion non-controlling interest in BHE. In BRK's annual report it is stated that it would cost Berkshire $11 billion if they had to acquire the remaining pieces of all their non-controlling interests (see the Contingencies and Commitments section) which is notably more than the $8,7 billion displayed on the balance sheet. Since we like to be more conservative, we’ll use the $11 billion number. Of these, BHE accounts for about $5 billion as we just saw. Burlington Northern Santa Fe, LLC (BNSF), is one of the largest freight railroads in North America. The company structure is a bit weird: it wholly-own “BNSF Railway Company” which in turn has some majority-owned subsidiaries. BNSF Railway operates over 32,500 route miles of track (excluding multiple main tracks, yard tracks and sidings) in 28 states and also operates in 3 Canadian provinces. It has an operating transportation services segment under which it transports a wide range of products and commodities, particularly (% and $ of total freight revenues for FY2021): All these products are obviously derived from various manufacturing, agricultural, and natural resource industries and it all adds up to: $ 21.87 billion of freight revenues which, when accounted for $0.6 billion of “Accessorial and other” items, makes the Total Operating Revenues of $22.51 billion. On a Net Income level it generates 7.11 billion of USD, an eye-popping income margin of 31.6% (again, it is a railway company, not a software company..). Source: financial information for FY2021 of BNSF. For more context we ought to compare it with its closest competitor, which, ironically is headquartered in the very city of Omaha, Nebraska (hometown of Warren Buffett), UNP (Union Pacific Corporation). UNP only operates in the USA but still offers a wide variety of transportation services (from grain and grain products, fertilizers, food and refrigerated products, and coal and renewables to grain processors, animal feeders, ethanol producers, and other agricultural users; petroleum, and liquid petroleum gasses; and construction products, industrial chemicals, plastics, forest products, specialized products, metals and ores, soda ash, and sand, as well as finished automobiles, automotive parts, and merchandise in intermodal containers). As of December 31, 2021, all this is done with an almost equivalent railroad network of 32,452 route miles. The railroads connect Pacific Coast and Gulf Coast ports with the Midwest and Eastern USA gateways. UNP has a FY2021 revenue of $20.24 billion with a Net Income of $6.52 billion (same astonishing 32% income margin). Considering the fact that they are pretty identical businesses both in type of operation and size, we can fairly assume that the market will value BNSF with the same multiples of UNP. UNP has currently a P/E of 22 and a market cap of $161 billion. It will be prudent to value BNSF at $140 billion (for an estimated-P/E just shy of 20) or a 13% discount on UNP. Source: SeekingAlpha’s page on UNP. Track Configuration - BNSF Railway operates over 32,500 route miles of track of which it owns over 23,000 route miles and it operates on over 9,000 route miles of trackage rights. These rights permit BNSF Railway to operate its trains with its crews over other railroads’ tracks. As of December 31, 2021, the total BNSF Railway system (including single and multiple main tracks, yard tracks, and sidings) consisted of over 50,000 operated miles of track. Business Mix - It serves mainly the Midwest, Pacific Northwest, Western, Southwestern, and Southeastern regions and ports of USA (as illustrated in the map below) under a fully owned services subsidiary. The mix of tracking rights and owned route allow BNSF to access cities also in Canada and Mexico. BNSF also serves smaller markets (approximately 200 shortline railroads). Here follows a detailed description of the different freight segments as stated in the BNSF official documents: Consumer Products: provided 38% of freight revenues for FY2021, and consisted of the following 3 business units: Industrial Products: provided 24% of freight revenues for FY2021, and consisted of the following 5 business units: Agricultural Products: provided 23% of freight revenues for FY2021. These products include: corn, wheat, ethanol, soybeans, bulk foods, fertilizer, oil seeds and meals, feeds, oils, flour and mill products, specialty grains, milo, barley, oats and rye, and malt. Coal: contributed 15% of freight revenues for FY2021. 90%+ of all of BNSF’s coal tons originates from the Powder River Basin of Wyoming and Montana. Much has already been written about it (both by financial commentators and Warren Buffett himself), so I’ll limit to the table BRK just published in its annual report. It is detailed below and also the recently purchased Occidental Petroleum, for which they were helding warrants. AAPL stock is the top holding at $161 billion or 45% of total portfolio. Please note that it was not intended to be like that in the first place, at the allocation level (Cost) it accounted for 30% ot total stocks or only double the second largest, BAC 15%. Source: BRK’s FY2021 annual report. Without adding more in the sense of difference between the insurance (or primary) and re-insurance (secondary) business model, I’d like to note one more fascinating thing. (I’m sorry we have to use EBIT figures instead of Net Income, but we only have those numbers, plus the ratios will not change and remain eloquent). Let’s take FY2021 and FY2020 form the Notes to Consolidated Financial Statements of BRK annual report (see image attached below): What it all means is that EBIT from investment (on the famous insurance “float'') ranges from 5 to 10 times more than EBIT from insurance underwriting. For every eleven dollars of insurance underwriting revenue, the insurance businesses produce one dollar of investment income EBIT (pretty higher than the 1% margin we calculated above.. that was one of the genius moves of Warren when it started acquiring insurance companies and of which he wrote at length in annual letters). How to value all this? I did it by assigning an arbitrary P/E of 4. BRK generates earnings of $5.535 billion (6.585-1.050 billion) from the Insurance business. So it means it is $20 billion worth of business. It seems a lot considering they are only underwriting a fraction (1/20) of that (around $1 billion per year), so I’ll do a double scenario: one considering it and another neglecting it. Source: BRK’s FY2021 annual report. From the table above (extracted from BRK annual report) we got all the different businesses of the holding company. Let’s focus on what is left to evaluate: i.e.: “McLane”, “Manufacturing” and “Service and retailing”. To get the Net Earnings we simply need to subtract “Income tax expense” from “Earnings before income tax”, obtaining a total value of north of $11 billion, $11.212 billion to be exact (0.169+7.648+3.395 billion USD). _$0.169 billion (0.230-0.061 billion) for McLane (the big supply chain services company which serves the likes of grocery and non-food to restaurants, military bases etc…); _$7.648 billion (9.841-2.193 billion) for “Manufacturing”; _$3.395 billion (4.481-1.086 billion) for “Service and retailing”. Using the same P/E method as above, we used a mean P/E of 16 (the long-time average of S&P 500), resulting in a market cap value for the three business categories of: $179.392 billion. Perhaps this is the most difficult part. In the image below is represented the Notes regarding the Income taxes, the “Deferred” part is of $90 billion of which $55 billion are unrealized appreciation on investments (it is safe to say that chances are they will never sell or at the very maximum sell just a 10% of it, so we’ll account for $5.5 billion on this). For all the remaining items of deferred tax liability we account for ⅔ of the written value, so it makes: $29.6 billion. Adding all up, we obtain $35.1 billion ($29.6+$5.5 billion). Source: BRK’s FY2021 annual report. I consider my style of investing to be really influenced by the school of Benjamin Graham and hence even that of Charles Munger and Warren Buffett, so I may have underestimate the potential risk of some accounting mistakes in the 10-K form and also they judgment in the soon-to-be new top managers (Mr. Greg Abel and Mr. Ajit Jain as CEO and co-CEO respectively). It may well end-up being a declining business as soon as the current ruling management team steps down. Perhaps you should judge this for yourself. For some more context on the soon-to-be management team: I’m long BRK and intend to slightly increase my (our) exposure by purchasing a bit more shares now that they are fairly valued. For a summary, see my post on eToro. Disclosure: I/we are long BRK.B. What BRK (Berkshire Hataway) is
A Practical Valuation Method
BRK Energy (BHE)
A Little Note About the Electricity Market in the USA: the Difference Between “regulated” and “nonregulated”
What About Real Estate?
BHE Valuation
Non-Controlling Interests
BNSF
A Little More on BNSF
Investments, “the Value Stock-Picking”
Insurance Businesses
Other Businesses (Smaller, non-Insurance)
Deferred Tax Liability
Possible Bias
Conclusion
info@peterlavi.com

About
Physician (MD) ・Stocks and ETFs investor ・10+ years of investing
・Keen on reading, reading and reading ・Writing on Forbes, SeekingAlpha, GuruFocus, and Yahoo Finance
A Different Angle Valuation of BRK, The “Sum of Parts” Method
A Different Angle Valuation of BRK, The “Sum of Parts” Method
2022-03-20 21:30
2022-03-20 21:30
Pietro Lavisci, MD
Pietro Lavisci, MD

Practical (but perhaps not perfect) valuation of the biggest US holding company...


Azimut: High-Margin Italian Asset Manager With Growing Private Markets – But At What Price?
Pietro Lavisci, MD

Lettera fine 2025 - Annual Letter
Pietro Lavisci, MD

Volatilità in Saldo: Leva Asimmetrica e Copertura del Rischio di Coda
Pietro Lavisci, MD
This material is provided for informational purposes only and does not constitute investment advice. Trading financial instruments involves significant risks, including potential loss of capital.
Past performance is not a reliable indicator of future results.
Market prices fluctuate, dividends and returns are uncertain, and exchange rate movements may affect investments denominated in foreign currencies. Each individual must assess their risk tolerance accordingly. No universal investment formula exists, and no financial instrument is risk-free. The data used in this material is obtained from sources believed reliable, though accuracy cannot be guaranteed. Being an investor means assuming risk with the aim of achieving returns.
Your capital is at risk | Copy Trading does not amount to investment advice | Your investments value may go up or down
www.peterlavi.com ©